To create a lookup table go to the “Programming” menu and page “Lookup tables” in the user interface of the CPU.
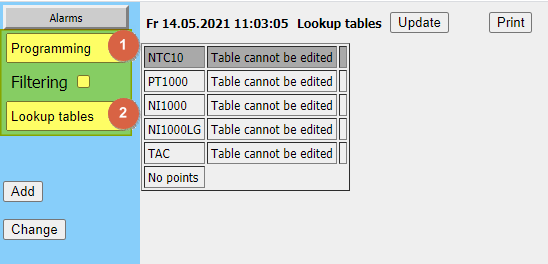
Fidelix CPU:s have certain resistive sensors lookup tables ready in the firmware. These tables can not be altered.
To create a new lookup table see steps below:
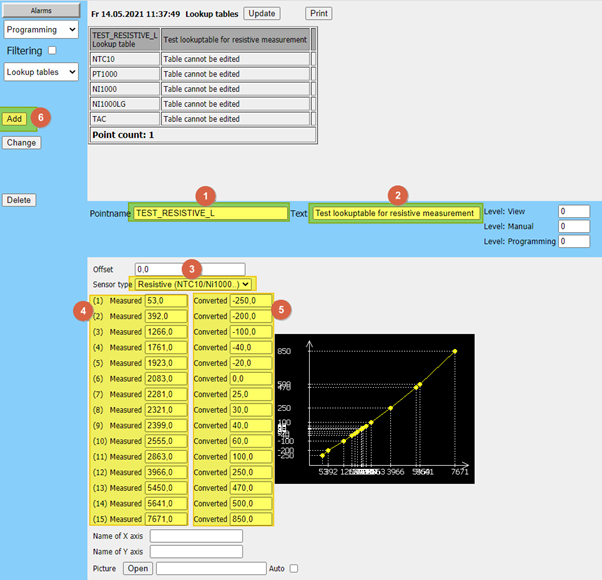
1. Create a new resistive sensor lookup table.
-
- Write a unique point name for the lookup table. Common practice is to use the suffix “_L” for lookup tables.
- Write an explanation for the lookup table.
- Choose sensor type as “Resisitve (NTC10/Ni1000..)”.
- Input the measured values of the sensor to the “Measured” side of the data fields. These values are the raw data from the analogue input module, not the actual resistance values. To see what values you need to input here, see article below on FX AI measurement point raw value table.
https://info.fidelix.fi/en/knowledge/fx-ai-measurement-point-raw-value-table
For ready lookup tables for most common resistive sensors see files in Fidelix download site: Download.Fidelix.com - Input the converted values to the “Converted” side of the data fields. These are the values you want to show as the measured value of the sensor.
- Press on “Add” button to create the lookup table.
- You can also give the axis of the graph different names with the “Name of X axis” and “Name of Y axis” fields.
Below is an example of a Pt100 sensors lookup table.
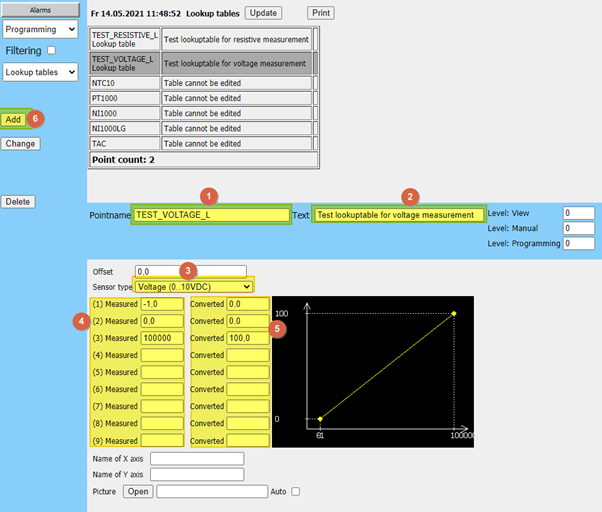
2. Create a new voltage measurement lookup table.
-
- Write a unique point name for the lookup table. Common practice is to use the suffix “_L” for lookup tables.
- Write an explanation for the lookup table.
- Choose sensor type as “Voltage (0..10VDC)”.
- Input the measured values of the sensor to the “Measured” side of the data fields. The measured value is the actual voltage times 10000. So for 0 V measured the value is 0, for 2 V measured the value is 20000 and for 10 V measured the value is 100000.
- Input the converted values to the “Converted” side of the data fields. These are the values you want to show as the measured value of the sensor.
- Press on “Add” button to create the lookup table.
- You can also give the give the axis of the graph different names with the “Name of X axis” and “Name of Y axis” fields.
Below is an example of a 0 – 10 V sensors lookup table, where the voltage is converted to 0 – 100 value.
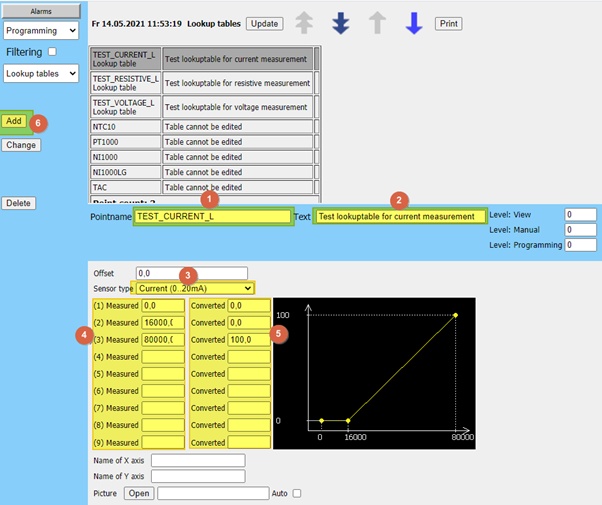
3. Create a new current measurement lookup table.
-
- Write a unique point name for the lookup table. Common practice is to use the suffix “_L” for lookup tables.
- Write an explanation for the lookup table.
- Choose sensor type as “Current (0..20mA).
- Input the measured values of the sensor to the “Measured” side of the data fields. The measured value range for 0..20mA is 0..80000. So for 0 mA measured the value is 0, for 4 mA measured the value is 16000 and for 20 mA measured the value is 80000.
- Input the converted values to the “Converted” side of the data fields. These are the values you want to show as the measured value of the sensor.
- Press on “Add” button to create the lookup table.
- You can also give the give the axis of the graph different names with the “Name of X axis” and “Name of Y axis” fields.
Below is an example of a 4 – 20 mA sensors lookup table, where the current is converted to 0 – 100 value.